Floods, Rivers and Historical Newspapers: Exploring the Past through Data
This project offers an alternative means to explore historical data through newspapers by investigating, through subject data, aspects of flood prevention in the recent past. Following this summer’s exceptional heat wave and drought, do we need to prepare for an onslaught of storms and thus, need to consider how to reduce the impact of flooding?
Using the digitised collection available on eluxemburgensia.lu, the project produces a list of subjects treated within the collection, including the number of newspapers per subject. Users can use the summary list to identify newspapers covering a desired topic, thereby gaining insight into how deeply a subject may be covered. The resulting list of entries can then be used to drill-down for specific articles.
The BnL provides information about digitised newspapers and serials available on the eluxemburgensia.lu portal as a list in json format with details about each publication. This includes the main metadata of each title, but not any subject related data, which is only available through an OAI-PMH (Open Archives Initiative Protocol for Metadata Harvesting) interface.
Jupyter Lab is used to encapsulate all the information regarding the project in a single notebook and Python is used as the programming language. The Jupyter notebook is available on GitHub: https://github.com/natliblux/OpenBNL-SubjectSummary.
The project consists of four steps:
- Retrieve the eluxemburgensia collection;
- Collect and collate the subject data for each entry;
- Display the subject list and request a selection from the user;
- Display the list of newspapers covering the selected subject to the user.
Retrieve the eluxemburgensia collection
We use the requests library to retrieve the collection and immediately convert it to json format.
# get the BnL eluxembourgensia collection
elux_collection = requests.get("https://viewer.eluxemburgensia.lu/api/viewer2/cms/v2/digitalcollections")
elux_collection = elux_collection.json()
Collect and collate the subject data for each entry
This step is the most involved for this project. The OAI-PMH interface supplies results in XML format. Subject data is available in multiple fields with tags ‘650’, ‘651’, ‘652’, ‘653’, ‘654’, and ‘655’. Not all datafields will be on all newspapers but we must check all of them for each newspaper in the collection.
Step 1: retrieve the document identifier
To do this, we have to parse out the az_url field to retrieve only the number part of the entry. An example of an az_url field is:
"az_url": "https://www.a-z.lu/discovery/fulldisplay?docid=alma990010878750107251&vid=352LUX_BNL:BIBNET_UNION"
We want to extract the data between “docid=alma” and the ampersand “&”:
# Find the positions of the start and end of the identifier required for the OAI call.
start = "docid=alma"
start_index = newspaper_linkaz.find(start)
end_index = newspaper_linkaz.find("&")
We then make the call to the OAI-PMH interface by building the expected newspaper OAI id and concatenating it to the end of our request string:
# Create the OAI ID for the newspaper
# Extract the text between “start” and “end” using slice operator
newspaper_oai_id = "oai:alma.352LUX_BIBNET_NETWORK:" + newspaper_linkaz[start_index + len(start):end_index].strip()
newspaper_oai_url = "https://oai.bibnet.lu/view/oai/352LUX_BIBNET_NETWORK/request?verb=GetRecord&metadataPrefix=marc21&identifier=" + newspaper_oai_id
Using the example above, the newspaper_oai_url becomes https://oai.bibnet.lu/view/oai/352LUX_BIBNET_NETWORK/request?verb=GetRecord&metadataPrefix=marc21&identifier=oai:alma.352LUX_BIBNET_NETWORK:990010878750107251
Step 2: parse the XML data received
We use the Python minidom parser to create a document tree and from that we can select all elements entitled “datafield”:
# Open XML document using minidom parser
DOMTree = minidom.parseString(newspaper_oai_data.text)
oai_pmh = DOMTree.documentElement
datafields = oai_pmh.getElementsByTagName("datafield")
We then loop through the data fiels looking for the tags listed above:
# loop through the data fields, looking for the tags for the subject values
for datafield in datafields:
   if datafield.hasAttribute('tag'):
      if datafield.getAttribute('tag') in subject_tag_values:
Step 3: store the subject with a count
At this point we need to store two things:
- the subject and how many newspapers refer to it:
# store the subject data and a count of the number of newspapers
subfields = datafield.getElementsByTagName("subfield")
subject = get_subfield_data(subfields)
add_subject(subject)
- the details of each newspaper within a subject:
# store the detailed information for use later
detailed_list[detailed_list_key] = {'Title' : newspaper_title, 'Subject' : subject, 'Start Date' : startdate, 'End Date' : enddate, 'Link' : newspaper_link}
detailed_list_key += 1
To add 1 to the subject count, we use a custom function declared earlier in the notebook:
# A function to add 1 to the count of an entry in a dict
# if no entry, add it to the dict with a count of 1
def add_subject(data):
 if (data in subject_list):
 num = subject_list[data]
      num += 1
      subject_list.update({data : num})
   else:
      subject_list[data]=1
Display the subject list and request a selection from the user
Before displaying the list, we sort it by the number of newspapers per subject, descending:
# sort the list by the number of newspapers, descending
subject_list_sorted = {k: v for k, v in sorted(subject_list.items(), key=lambda item: item[1], reverse=True)}
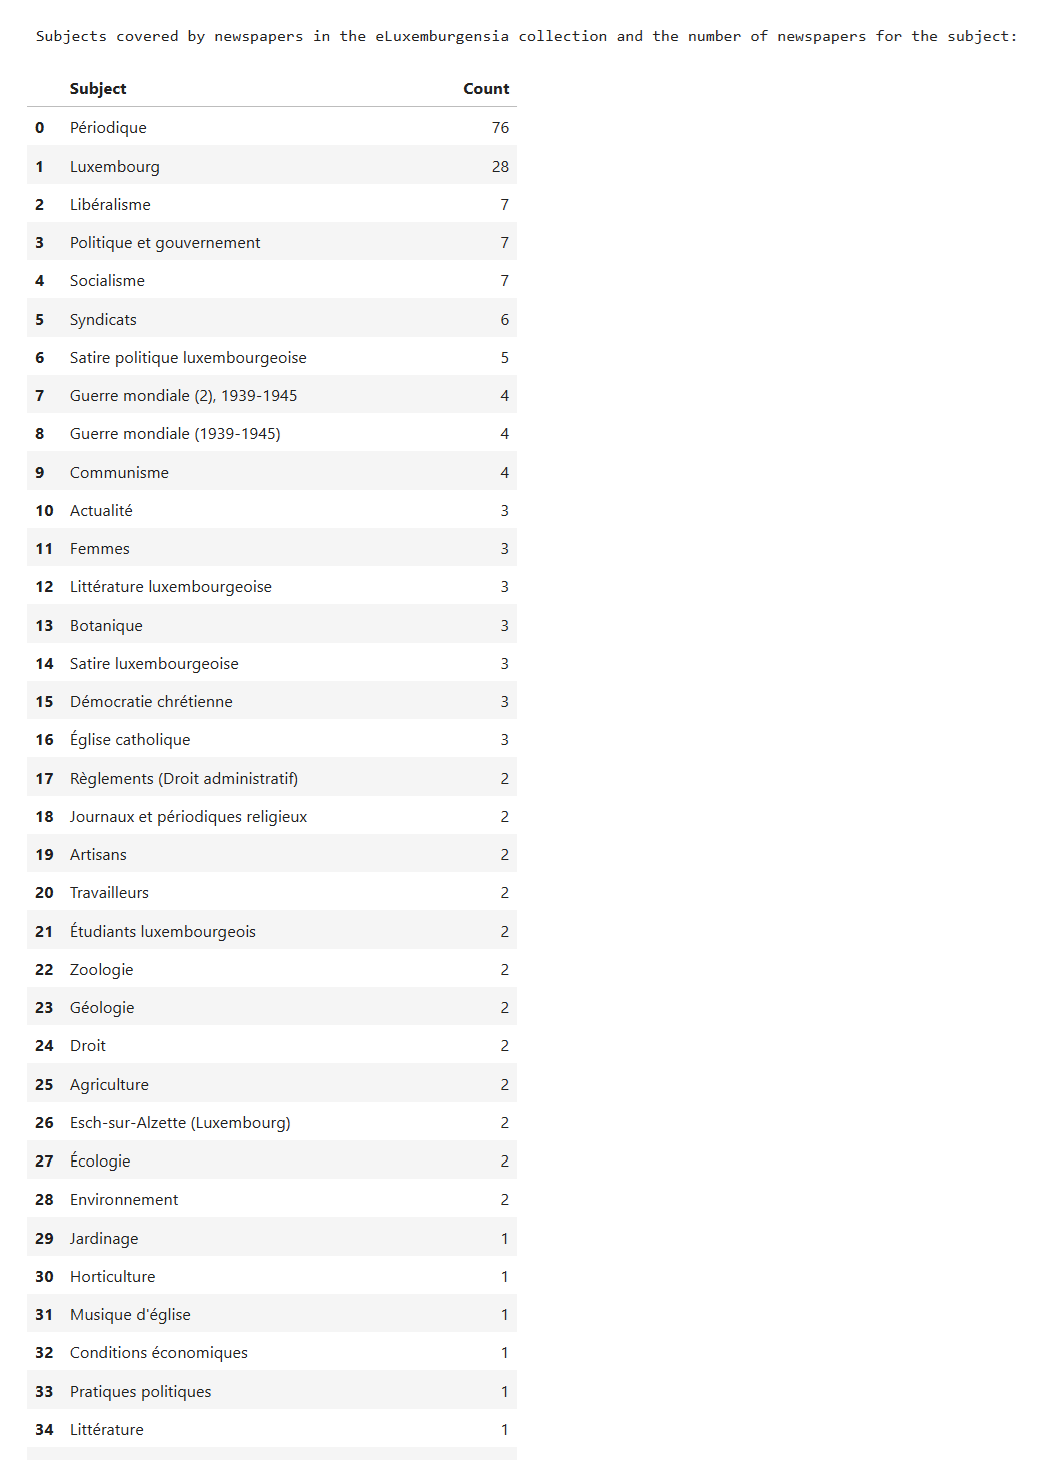
We then use a Pandas DataFrame to easily display tabular data:
# create a data frame for display purposes
df = pd.DataFrame(subject_list_sorted.items(), columns=["Subject", "Count"])
dfStyler = df.style.set_properties(subset=["Subject"],**{'text-align': 'left'})
dfStyler.set_table_styles([dict(selector='th', props=[('text-align', 'left')])])
Using standard Python, we request a selection from the user and wait until a response is received:
# Request an entry number from the user
chosen_entry = ''
while (chosen_entry=='' or chosen_entry.isdigit() == False):
   chosen_entry = input("Enter the number of the subject for which you wish more information: ")
   if '' == chosen_entry or chosen_entry.isdigit() == False :
      print('Please enter a number.')
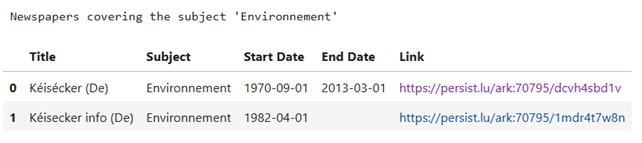
Display the list of newspapers covering the selected subject to the user
Once we have the user’s choice, it is a simple case of locating the correct entry in the detailed list and displaying the tabular data, again, using a Pandas DataFrame.
# Find all keys with the given value
# An empty list to store matching keys
chosen_items = []

# Loop through dictionary items and find all entries where the subject of the newspaper is the one chosen by the user
for key, value in detailed_list.items():
   if value['Subject'] == specific_row['Subject']:
      chosen_item = {'Title' : value['Title'], 'Subject' : value['Subject'], 'Start Date' : value['Start Date'], 'End Date' : value['End Date'], 'Link' : value['Link']}
      chosen_items.append(chosen_item)

print("\nNewspapers covering the subject '" + specific_row['Subject'] + "'\n")

# function to make the URL link clickable
def make_clickable(val):
 return f'<a target="_blank" href="{val}">{val}</a>'

# create a data frame with the list of chosen items
chosen_df = pd.DataFrame(chosen_items, columns=["Title", "Subject", "Start Date", "End Date", "Link"])
dfStyler = chosen_df.style.set_properties(**{'text-align': 'left'})
dfStyler.set_table_styles([dict(selector='th', props=[('text-align', 'left')])])
dfStyler.format({'Link': make_clickable})